Abstract
![]() This tool allows you to look for specific entries
in various log files, therefore making it easier to search for
particular incidents or security threats.
This tool allows you to look for specific entries
in various log files, therefore making it easier to search for
particular incidents or security threats.
Additionally a nifty wizard allows you to set up mail alerts to warn you whenever the load is too high on your machine, or when a service is down.
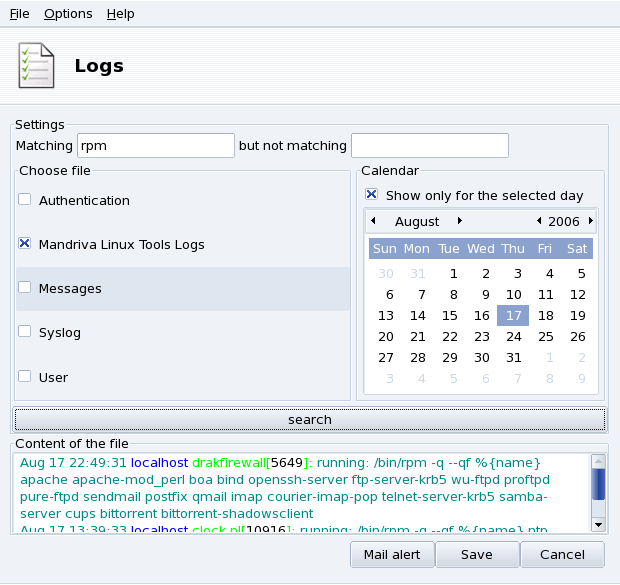
These are the steps to follow in order to browse or look for a specific event into the system logs:
-
Matching Terms
You must choose which specific words to match by filling the Matching (log files contain the words) field and/or the but not matching (log files which don't contain the words) field. At least one of the two fields must be filled.
-
Log File
Then in the Choose file area select the file you want to perform the search on. Simply check the corresponding box.
-
Date of Event
Optionally, you can restrict the search to a specific day. In that case, check the Show only for the selected day box and choose the desired day from the calendar.
-
Search
When all is set up, click on the button. The results appear in the Content of the file area at the bottom.
Clicking on the
button opens a standard dialog letting
you save the search results into a plain text
(*.txt) file.
Abstract
In order to facilitate server monitoring, Mandriva Linux supplies a simple tool which sends automatic mail alerts whenever something goes wrong on your server.
Clicking on the button of the LogDrake main interface (see Figure 5.4, “Browsing and Searching through System Logs”) starts the wizard. First you're asked whether you wish to configure or stop the mail alert system. Choose Configure the mail alert system entry in the pull-down list, and click .
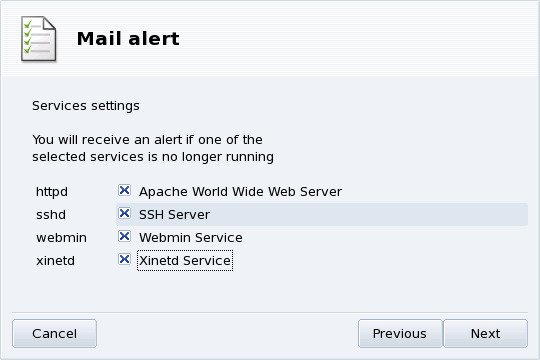
The next step (Figure 5.5, “Setting up a Mail Alert: Services”) allows you to select the services you wish to receive alerts about if they stop working. Simply check the service boxes which interest you.
![[Note]](images/note.png) |
Note |
|---|---|
|
The services listed are the ones present on your system. Here's a list of the currently trackable ones: |
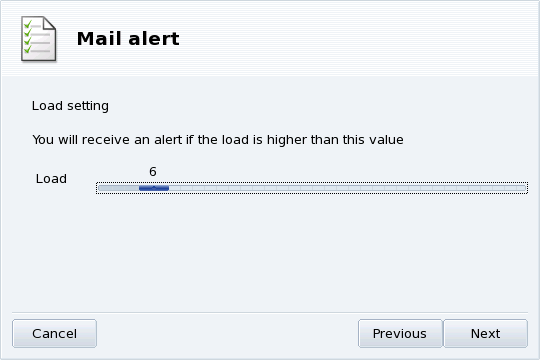
Select the load you which you consider unacceptable by moving the Load slider (Figure 5.6, “Setting up a Mail Alert: Load”). A high system load may indicate that a process has gone out of control, or simply that there's a very high demand on this machine. Therefore a service is suffering from it and is delayed. As a rule of thumb, the load on your computer should not exceed 3 times the number of processors you have on it.
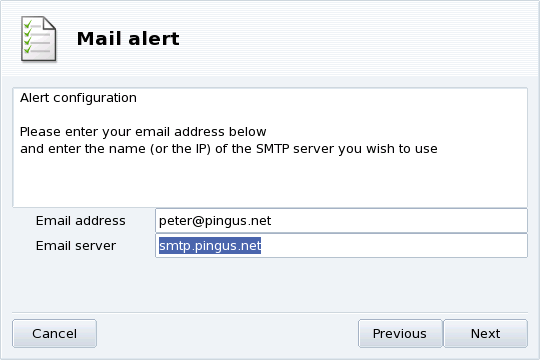
Finally you need to tell the system to whom these alerts should be sent (Figure 5.7, “Setting up a Mail Alert: Recipient”). Provide an e-mail address and the mail server (local or on the Internet) to relay the alerts to.
When the wizard is finished, an hourly check is set up to verify services availability and the system's load. If needed a mail alert is sent to the alerts' recipient until the problem is solved.