| 📰 Title: | LabPlot | 🕹️ / 🛠️ Type: | Tool |
|---|---|---|---|
| 🗃️ Genre: | Puzzle | 👁️ Visual: | 2D |
| 🏷️ Category: | Puzzle ➤ E-learning ➤ Mathematics | 🏝️ Perspective: | First person (interface) |
| 🔖 Tags: | E-learning; Mathematics | ⏱️ Pacing: | Real Time |
| 🐣️ Approx. start: | 2008-03-03 | 👫️ Played: | Single |
| 🐓️ Latest: | 2024-07-16 | 🚦 Status: | 04. Released (status) |
| 📍️ Version: | Latest: 2.11.0 / Dev: e59ee7e6 | ❤️ Like it: | 9. ⏳️ |
| 🏛️ License type: | 🕊️ Libre | 🎀️ Quality: | 7. ⏳️ |
| 🏛️ License: | GPL-2+ | ✨️ (temporary): | |
| 🐛️ Created: | 2019-03-10 | 🐜️ Updated: | 2024-09-09 |
| 📦️ Package name: | labplot | ..... 📦️ Arch: | |
|---|---|---|---|
| 📄️ Source: | ..... 📦️ RPM: | ||
| ⚙️ Generic binary: | ..... 📦️ Deb: | ||
| 🌍️ Browser version: | ..... 📦️ AppImage: | ||
| 📱️ PDA support: | ..... 📦️ Flatpak: | ||
| ✨️ Not use: | ..... 📦️ Snap: |
| 📰 What's new?: | 👻️ Temporary: | ||
|---|---|---|---|
| 💡 Lights on: | 🎨️ Significant improvement: | ||
| 👔️ Already shown: | 💭️ New version published (to be updated): | ||
| 🎖️ This work: | 🚧️ Some work remains to be done: | ||
| 👫️ Contrib.: | goupildb & Louis | 🦺️ Work in progress: | |
| 🎰️ ID: | 15560 |
| 📜️[en]: | A libre, multi-platform mathematical tool for drawing interactive graphics and analyzing scientific data. Charts can be produced from its spreadsheet (with basic functions for data entry or random number generation) or via the import of external files. In return, it exports to different formats (ASCII, PDF, EPS, PNG and SVG) and offers linear / non-linear fits functions to data according to predefined or custom models (with arbitrary number of parameters). | 📜️[fr]: | Un outil mathématique libre et multi-plateforme pour tracer des graphiques interactifs et analyser des données scientifiques. Les graphiques peuvent être produits depuis sa feuille de calcul (disposant de fonctions de base pour l'entrée des données ou la génération de nombres aléatoires) ou via l'import de fichiers externes. En retour il exporte vers différents formats (ASCII, PDF, EPS, PNG et SVG) et offre des fonctions d'ajustement linéaire / non linéaires aux données suivant des modèles prédéfinis ou personnalisés (au nombre arbitraire de paramètres). |
|---|
🦉️ From Devs : (202201), (201610),
🕯️ How To:
• 💥️ The FREE OriginPro Alternative for Researchers (Multiple Peak Fit) (202407), 💥️ The FREE OriginPro Alternative for Researchers (Download and Installation) (202407), 💥️ How to export publication-quality plots (202308),
• How To Plot Functions (202206),
🎮️ Showcase: (201805), (201808), (201709),
🏡️ Website & videos
[Homepage] [Dev site] [Features/About] [Screenshots] [Videos pv(2.7/201909) pv(2.7/201909) ft(201802) ft(201806) ft(201709) ft(201709) t(202xxx) ts(202xxx) gd(202201) gd(201610) gu(202xxx) r(202xxx) lp(202xxx) ht(202407) ht(202407) ht(202206) ht(202212) ht(202212) ht(202201) d(201805) d(201808) d(201709) d(201806) d(201707) d(201608) d(201612) d(201604) g(202xxx) g[fr](202xxx) g[de](202xxx) g[ru](202xxx) g[pl](202xxx) g[cz](202xxx) g[sp](202xxx) g[pt](202xxx) g[it](202xxx) g[tr](202xxx)] [WIKI] [FAQ] [RSS] [Changelog 1 2 3]
💰 Commercial
• [Support their work (Donate)]
🍩️ Resources
🔘️ News & Informations
• References (a list of external resources mentioning LabPlot and its usage in various areas): [Homepage] [Dev site] 🎬️ g(202xxx)
🛠️ Technical informations
[Open Hub] [PCGamingWiki] [MobyGames] [KDE (Example Projects)]
🦣️ Social
Devs (LabPlot Team [fr] [en]): [Site 1 2] [Chat] [mastodon] [PeerTube] [YouTube] [PressKit] [Interview 1(202xxx) 2(202xxx)]
Devs (KDE 1 2 [fr] [en]): [Site 1 2] [Support their work (Donate)] [Chat] [mastodon] [vk] [X] [Facebook] [PeerTube] [YouTube] [reddit] [PressKit] [Interview 1(Matthias Ettrich, Founder of KDE) (202111) 2(202xxx)]
The Project: [Blog] [Chat] [Forums] [mastodon] [PeerTube] [YouTube] [PressKit] [reddit] [Discord]
🐝️ Related
[Wikipedia (LabPlot) [fr] [en] [de]]
[Wikipedia (KDE Education Project) [fr] [en] [de]]
[FreshFOSS]
📦️ Misc. repositories
[Repology] [pkgs.org] [Generic binary] [Arch Linux / AUR] [openSUSE] [Debian/Ubuntu] [Flatpak] [AppImage(author's repo)] [Snap] [PortableLinuxGames]
🕵️ Reviews
[HowLongToBeat] [metacritic] [OpenCritic] [iGDB]
🕊️ Source of this Entry: [Site (date)]
🦣️ Social Networking Update (on mastodon)
🛠️ Title: LabPlot
🦊️ What's: A libre math tool for drawing interactive graphics & analyzing scientific data
🏡️ https://kde.org/applications/education/labplot
🐣️ https://invent.kde.org/education/labplot
🦉️ https://floss.social/@LabPlot
🔖 #LinuxGaming #ShareYourGames #ELearning #Mathematics
📦️ #Libre #Arch #RPM #Deb #Flatpak #Snap
📖 Our entry: (homeless)
🥁️ Update: 2.11.0
⚗️ Consistent version 🦍️
📌️ Changes: https://labplot.kde.org/news/
🦣️ From: https://floss.social/@LabPlot/112796650843881221
🛜️ https://labplot.kde.org/feed/
🦉️ https://www.youtube.com/embed/Ngf1g3S5C0A
💥️🕯️https://www.youtube.com/embed/GDZT-40J_RE
🕯️https://tube.kockatoo.org/videos/embed/rALKFDeCxpMUxaCVeTunAi
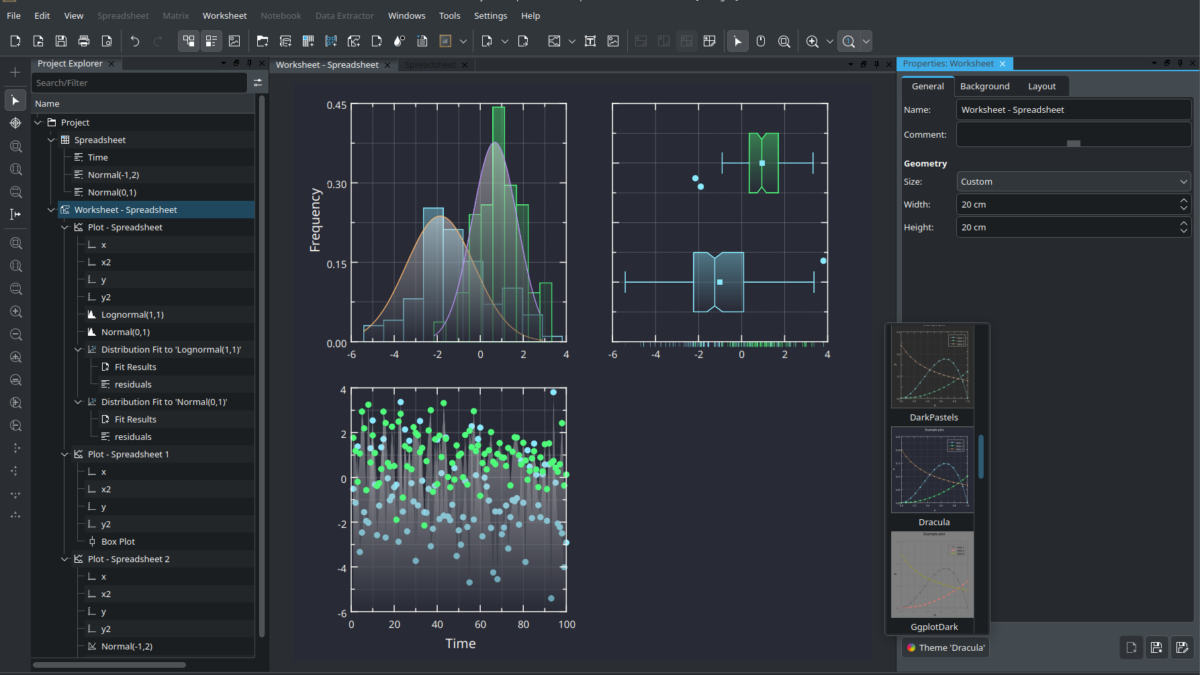
🕶️ A view of the user interface, on a dark theme, showing an example of the many types of presentation it offers, with in this case 3 different types of graphs (curves, histograms, scatterplots, ...). At the top and left of the user interface are numerous icons providing access to its functionalities.
📚️ LabPlot is a libre, multi-platform mathematical tool for drawing interactive graphics and analyzing scientific data. Charts can be produced from its spreadsheet (with basic functions for data entry or random number generation) or via the import of external files. In return, it exports to different formats (ASCII, PDF, EPS, PNG and SVG) and offers linear / non-linear fits functions to data according to predefined or custom models (with arbitrary number of parameters).
📜️ "A libre mathematical tool for drawing interactive graphics & analyzing scientific data" 📜️
LabPlot
FREE, open source and cross-platform Data Visualization and Analysis software accessible to everyone
FEATURE HIGHLIGHTS
What can you expect?
✅️ High-quality data visualization and plotting with few clicks
✅️ Reliable and easy data analysis and statistics, no coding required
✅️ Intuitive and fast computing with interactive notebooks
✅️ Effortless data extraction from images
✅️ Smooth data import and export to and from multiple formats
✅️ Available for Windows, macOS, Linux and FreeBSD
Features
General
• Project based management of data
• Tree-like organization (parent-child hierarchy) of created object, navigation is done in Project Explorer
• Folders and sub-folders within the project for a better object management
• Spreadsheet and Matrix – data-container serving as the data source used in data analysis and visualization
• Worksheet – area for placing different visualization objects (plots, labels, images, etc) supporting different layouts, zooming and navigation modi
• Extensive and interactive editing capabilities
• Support for Latex syntax in labels (plot and axis titles, etc.)
• Extensive parser for mathematical expressions supporting great number of functions and constants, used for data generation, analysis and visualization
• Elaborative documentation supporting the user with detailed examples und tutorials
2D-Plotting
• Cartesian plot with an arbitrary number of freely positionable axes
• Ordinary and cumulative histograms with different binning methods
• Several zooming and navigation modi in the plot
• Feature-rich and freely positionable plot legend
• Arbitrary number of curves in the plot, defined either via a mathematical equation or by providing data sources
Data Analysis
• Linear and non-linear regression analysis, support for several predefined and user-defined fit models
• Numerical differentiation (up to the 6th order) and numerical integration (rectangular, trapezoid and Simpson methods)
• Smoothing of data with moving average, Savitzky-Golay and percentile filter methods
• Interpolation of data, support for many methods (linear, polynom, splines, piecewise cubic Hermite polynoms, etc.).
• Fourier transform of the input data with support for many different window functions (Hann, Hamming, Blackman, etc.)
• Fourier Filter – low-pass, high-pass, band-pass and band-reject filters of different types (Butterworth, Chebyshev I+II, Legendre, Bessel-Thomson)
• Convolution and deconvolution of data sets
• Auto- and cross-correlation of data sets
Computing
• Support for different open-source computer algebra systems (CAS) like Maxima, Octave, etc.
• Computation can be done directly in LabPlot, provided the corresponding CAS is installed
• CAS variables holding array-like data (Maxima lists, Python lists and tuples, etc.) can be used as the source for LabPlot curves
Import/Export
• Support for ASCII, binary, HDF5, netCDF, FITS, ROOT, Ngspice and JSON formats with many options to control the import process
• For hierarchical formats like HDF5, netCDF, FITS and ROOT user-friendly visualization of the file content for data navigation and selection is available
• Import of Origin® projects
• Export of Worksheet (entire worksheet or current selection) to PDF, EPS, PNG and SVG
• Export of data containers Spreadsheet and Matrix to Latex tables
• Support for drag&drop of files to be imported
Data Extraction
• Easy extraction of data from external image files
• Cartesian, polar, logarithmic and ternary corrdinate system
• Symmetric and asymmetric error bars
• Manual point-by-point extraction of data points or (semi-)automated extraction of curve segments
• Multiple curves on the image can be read
• Basic image editing capabilities to reduce the image information to the relevant minimum
• Extracted data is added to a spreadsheet and is directly ready to use
🍥️ Debian:
Interactive graphing and analysis of scientific data
LabPlot provides an easy way to create, manage and edit plots. It allows you to produce plots based on data from a spreadsheet or on data imported from external files. Plots can be exported to several pixmap and vector graphic formats.
Features include:
• project-based management of data
• project explorer for management and organization of created objects in different folders and sub-folders
• spreadsheet with basic functionality for manual data entry or for generation of uniform and non-uniform random numbers
• import of external ASCII data into the project for further editing and visualization
• export of spreadsheet to an ASCII file
• worksheet as the main parent object for plots, labels, etc; supports different layouts and zooming functions
• export of worksheet to different formats (PDF, EPS, PNG, and SVG)
• great variety of editing capabilities for properties of worksheet and its objects
• cartesian plots, created either from imported or manually created data sets or via mathematical equation
• definition of mathematical formulas is supported by syntax highlighting and completion and by the list of thematically grouped mathematical and physical constants and functions
• analysis of plotted data is supported by many zooming and navigation features
• linear and non-linear fits to data, several fit-models are predefined and custom models with arbitrary number of parameters can be provided
🌍️ Wikipedia:
LabPlot is a free software and multi-platform computer program for interactive scientific graphing and data analysis, written for the KDE desktop. It is similar to Origin and is able to import Origin's data files.
History and Perspective
LabPlot was initiated by Stefan Gerlach, a scientist and IT administrator at the University of Konstanz. He separately published liborigin, a library for reading OriginLab OPJ project files.
In 2008, developers of LabPlot and SciDAVis (another Origin clone, forked from QtiPlot) "found their project goals to be very similar" and "decided to start a close cooperation" with the aim of merging their code into a common backend, while maintaining "two frontends, one with full KDE4 integration (called LabPlot 2.x) and one with no KDE dependencies (pure Qt so to say) for easier multi-platform use (called SciDAVis)".
In September 2016, LabPlot moved its website from labplot.sourceforge.net to labplot.kde.org.
Features
It uses the Qt widget set for its graphical interface. It is integrated with the KDE desktop and has drag and drop support with KDE's applications. The handbook is written in KDE and conforms to the Khelpcenter standards. It is scriptable using Qt Script for Applications (QSA). 2D and 3D plots of data can be rendered in a "worksheet", either by directly reading datafiles or from a spreadsheet, which LabPlot supports. It has interfaces to several libraries, including GSL for data analysis, the Qwt3d libraries for 3D plotting using OpenGL, FFTW for fast Fourier transforms and supports exporting to 80 image formats and raw PostScript. Other key features include support for the FITS format, for LaTeX and Rich Text labels, data masking, multiple plots in the same worksheet, pie charts, bar charts/histograms, interpolation, data smoothing, peak fitting, nonlinear curve fitting, regression, deconvolution, integral transforms, and others (see developers website listed below for details). The graphs are publication-quality. Interface translated in various languages.
Un outil mathématique pour tracer des graphiques interactifs et analyser des données scientifiques, par la LabPlot Team & KDE.
LabPlot est un outil mathématique libre et multi-plateforme pour tracer des graphiques interactifs et analyser des données scientifiques. Les graphiques peuvent être produits depuis sa feuille de calcul (disposant de fonctions de base pour l'entrée des données ou la génération de nombres aléatoires) ou via l'import de fichiers externes. En retour il exporte vers différents formats (ASCII, PDF, EPS, PNG et SVG) et offre des fonctions d'ajustement linéaire / non linéaires aux données suivant des modèles prédéfinis ou personnalisés (au nombre arbitraire de paramètres).
LabPlot
Logiciel LIBRE et multi-plateforme de visualisation et d'analyse de données accessible à tous.
CARACTÉRISTIQUES PRINCIPALES
Que pouvez-vous en attendre ?
✅️ Visualisation et traçage de données de haute qualité en quelques clics.
✅️ Analyse de données et statistiques fiables et faciles, sans codage requis
✅️ Calcul intuitif et rapide grâce aux blocs-notes interactifs
✅️ Extraction de données sans effort à partir d'images
✅️ Importation et exportation fluides de données depuis et vers de multiples formats.
✅️ Disponible pour Windows, macOS, Linux et FreeBSD
Caractéristiques
Générales
• Gestion des données par projet
• Organisation en arborescence (hiérarchie parents-enfants) des objets créés, la navigation se fait dans l'explorateur de projet.
• Dossiers et sous-dossiers au sein du projet pour une meilleure gestion des objets.
• Feuille de calcul et matrice - conteneur de données servant de source de données pour l'analyse et la visualisation des données.
• Feuille de travail - zone permettant de placer différents objets de visualisation (graphiques, étiquettes, images, etc.) avec différentes mises en page, zooms et modes de navigation.
• Capacités d'édition étendues et interactives
• Prise en charge de la syntaxe Latex dans les étiquettes (titres des graphiques et des axes, etc.)
• Analyseur d'expressions mathématiques étendu prenant en charge un grand nombre de fonctions et de constantes, utilisé pour la génération, l'analyse et la visualisation des données.
• Documentation élaborée soutenant l'utilisateur avec des exemples détaillés et des tutoriels.
Tracé 2D
• Tracé cartésien avec un nombre arbitraire d'axes librement positionnables
• Histogrammes ordinaires et cumulatifs avec différentes méthodes de binning
• Plusieurs modes de zoom et de navigation dans le graphique
• Légende du tracé riche en fonctionnalités et librement positionnable
• Nombre arbitraire de courbes dans le tracé, définies soit par une équation mathématique, soit par des sources de données.
Analyse des données
• Analyse de régression linéaire et non linéaire, support de plusieurs modèles d'ajustement prédéfinis et définis par l'utilisateur.
• Différenciation numérique (jusqu'à l'ordre 6) et intégration numérique (méthodes rectangulaire, trapézoïdale et de Simpson)
• Lissage des données avec les méthodes de moyenne mobile, de Savitzky-Golay et de filtre percentile.
• Interpolation des données, support de nombreuses méthodes (linéaire, polynôme, splines, polynômes d'Hermite cubiques par morceaux, etc.)
• Transformation de Fourier des données d'entrée avec prise en charge de nombreuses fonctions de fenêtre (Hann, Hamming, Blackman, etc.).
• Filtre de Fourier - filtres passe-bas, passe-haut, passe-bande et coupe-bande de différents types (Butterworth, Chebyshev I+II, Legendre, Bessel-Thomson)
• Convolution et déconvolution d'ensembles de données
• Autocorrélation et corrélation croisée d'ensembles de données
Calcul
• Support de différents systèmes de calcul formel (CAS) open-source comme Maxima, Octave, etc.
• Les calculs peuvent être effectués directement dans LabPlot, à condition que le CAS correspondant soit installé.
• Les variables CAS contenant des données de type tableau (listes Maxima, listes et tuples Python, etc.) peuvent être utilisées comme source pour les courbes LabPlot.
Importation/Exportation
• Support des formats ASCII, binaire, HDF5, netCDF, FITS, ROOT, Ngspice et JSON avec de nombreuses options pour contrôler le processus d'importation.
• Pour les formats hiérarchiques comme HDF5, netCDF, FITS et ROOT, une visualisation conviviale du contenu du fichier est disponible pour la navigation et la sélection des données.
• Importation de projets Origin®.
• Exportation de la feuille de calcul (feuille de calcul entière ou sélection actuelle) vers PDF, EPS, PNG et SVG.
• Exportation des conteneurs de données (feuilles de calcul et matrices) vers des tableaux Latex.
• Prise en charge du glisser-déposer des fichiers à importer
Extraction de données
• Extraction facile de données à partir de fichiers d'images externes
• Système de coordonnées cartésiennes, polaires, logarithmiques et ternaires
• Barres d'erreur symétriques et asymétriques
• Extraction manuelle point par point des points de données ou extraction (semi-)automatique des segments de courbe
• Possibilité de lire plusieurs courbes sur l'image
• Capacités d'édition d'image de base pour réduire les informations de l'image au minimum pertinent
• Les données extraites sont ajoutées à une feuille de calcul et sont directement prêtes à être utilisées.
🍥️ Debian:
Tracé et analyse interactifs de données scientifiques
LabPlot fournit un moyen de créer, gérer et d’éditer des tracés de données. Il permet de produire des tracés à partir de données de feuille de calcul ou importées de fichiers externes. Les tracés peuvent être exportés dans plusieurs formats de graphismes matriciels ou vectoriels.
Ses fonctionnalités incluent :
• gestion des données par projet ;
• explorateur de projet pour la gestion et l’organisation des objets créés dans différents dossiers ou sous-dossiers ;
• feuille de calcul avec les fonctions de base pour la saisie manuelle des données ou pour la génération de nombres aléatoires uniformes ou non ;
• importation de données ASCII externes dans le projet pour une édition et visualisation ultérieures ;
• exportation de feuille de calcul dans un fichier ASCII ;
• feuille de travail comme objet parent principal pour des tracés, des étiquettes, etc., prise en charge de différentes mises en page et de fonctions d’agrandissement ;
• export de feuille de travail dans différents formats (PDF, EPS, PNG et SVG) ;
• grande variété de possibilités d’édition des propriétés de feuille de travail et d’objet ;
• tracés cartésiens créés soit à partir de données importées ou créées manuellement, soit à l’aide d’équations mathématiques ;
• définition de formule mathématique gérée par coloration syntaxique et complétion, et par la liste, groupées par thème, de constantes et fonctions mathématiques et physiques ;
• analyse des tracés prise en charge par de nombreuses fonctions de zoom et navigation ;
• ajustements aux données linéaires ou non, plusieurs modèles d’ajustements prédéfinis et possibilité de modèles usuels avec un nombre arbitraire de paramètres.